Key takeaways:
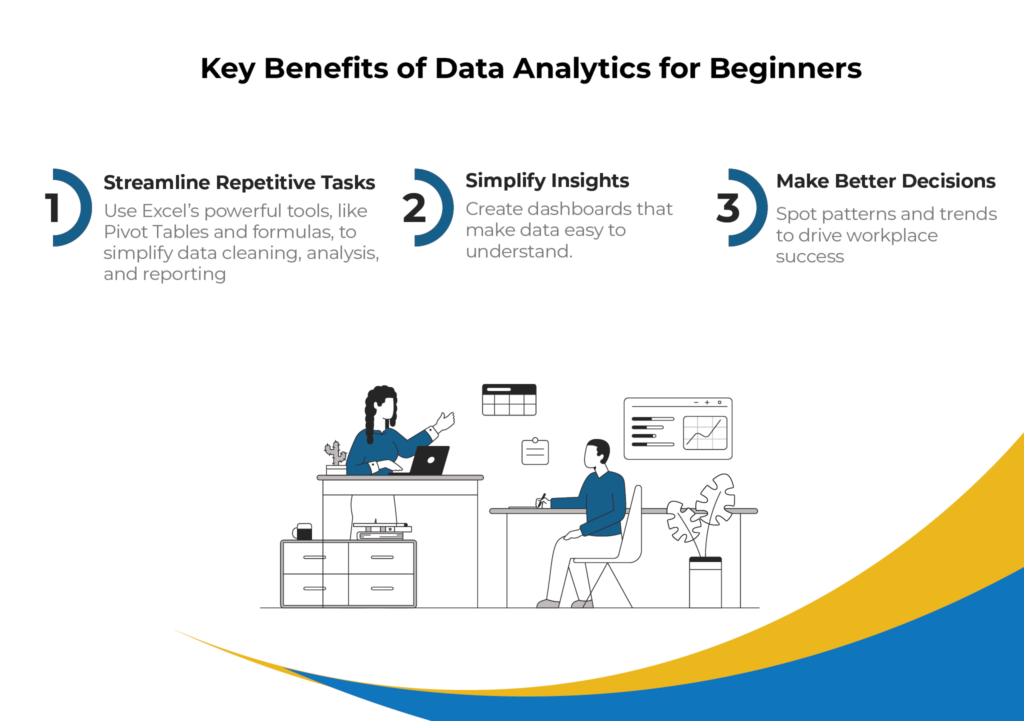
- Tools like Excel and Power BI simplify data analysis with Pivot Tables, charts, and formulas.
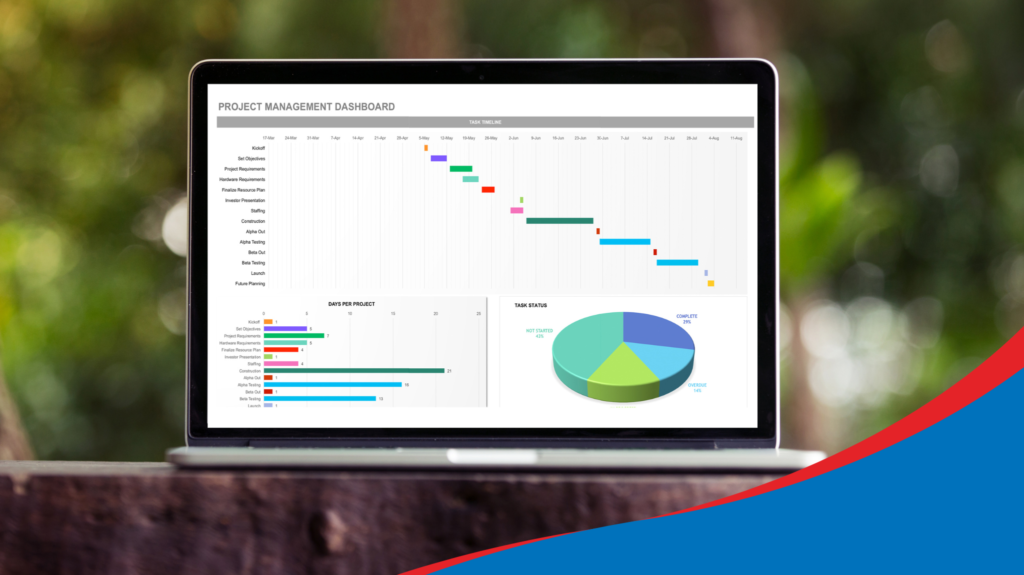
- Learn to clean datasets, identify trends, and create dashboards to save time and make better decisions
- Save hours on tasks, deliver meaningful insights, and improve team decision-making with your new skills.
Think data analytics requires SQL or Python? You’re not alone. Many assume it’s reserved for tech experts, but the reality is far more accessible. We understand that as a working professional, you don’t have time to get lost in technical jargon. You need practical tools to make better decisions, create impactful reports, and uncover insights that matter.
What is Data Analytics, really?
Data analytics is about making sense of large amounts of information—organising messy datasets, identifying patterns, and using insights to make smarter decisions. For example, it’s like analysing thousands of sales records to uncover trends in customer behaviour or tracking performance metrics across multiple departments to spot areas for improvement.
Overwhelmed by the thought of starting? Here’s the good news: you don’t need to be a tech expert. Tools like Excel simplify the process with features like Pivot Tables, formulas, and charts that do the heavy lifting for you
Why Data Analytics Isn’t as Complicated as You Think
JCI’s beginner-friendly courses are designed to simplify data analytics and make it accessible for everyone. Instead of technical jargon, we focus on practical tools like Excel, guiding you step by step through tasks like cleaning datasets, identifying patterns, and creating visual reports.
If you’re ready to make data analytics work for you, James Cook Institute offers two beginner-friendly courses designed to equip you with practical, job-ready skills:
Build a Strong Foundation with WSQ Effective Data Analysis Using Excel
Perfect for beginners and professionals, this two-day course equips you with the foundational skills to clean, analyse, and visualise data, empowering you to tackle real-world business challenges with confidence.
What You’ll Learn
Clean and Organise Data: Transform messy datasets into clear, actionable insights to make better decisions at work.
Analyse Trends and Patterns: Use Excel’s advanced functions, Pivot Tables, and Power Pivot to uncover key business trends that drive results.
Streamline Data Analysis: Automate repetitive tasks and extract data from multiple sources, saving you hours on reporting and analysis.
Build Interactive Dashboards: Create professional dashboards that simplify complex data and impress stakeholders in meetings.
With these skills, you’ll be able to tackle data challenges confidently, deliver meaningful insights, and add immediate value to your role.
Take the Next Step: Introduction to Data Analysis Using Excel and Power BI
Ready to expand your data analytics skills? JCI’s Introduction to Data Analysis Using Excel and Power BI is designed for those who already have a basic understanding of Excel and want to explore deeper insights with advanced techniques and tools like Power BI.
What You’ll Learn
Advanced Data Analysis with Excel: Go beyond the basics by applying functions and formulas to perform statistical techniques like mean, median, and regression analysis – essential for uncovering trends and supporting informed business decisions.
Identify Trends for Smarter Decisions: Use statistical analysis to spot patterns in your data, helping you optimise processes, forecast outcomes, and make data-driven recommendations to your team.
Identify Trends for Smarter Decisions: Use statistical analysis to spot patterns in your data, helping you optimise processes, forecast outcomes, and make data-driven recommendations to your team.
Combine Data for Comprehensive Analysis: Import and prepare datasets from multiple sources, giving you the ability to handle larger and more complex data for strategic insights
Develop Key Metrics for Stakeholders: Use basic DAX formulas to create KPIs, scorecards, and dashboards that enable stakeholders to quickly assess performance and take action.
Kickstart Your Data Analytics Journey Today
With our WSQ Effective Data Analysis Using Excel and Introduction to Data Analysis Using Excel and Power BI, you’ll be ready to tackle workplace challenges, save time, and deliver insights that drive smarter decisions.
Upskill now and take the first step toward mastering data analytics with JCI’s WSQ accredited courses