
Key Takeways:
- Power BI simplifies complex data analysis through real-time dashboards, automated refreshes, and interactive visualisations that make insights easy to digest.
- It empowers professionals to make faster, data-driven decisions by unifying data from multiple sources and visualising performance metrics with clarity.
- At James Cook Institute, learners gain hands-on, job-ready skills to apply Power BI in real business contexts — transforming raw data into real impact.
For decades, Microsoft Excel has been the go-to tool for data analysis in the workplace. But with businesses generating more data than ever before, traditional spreadsheets often fall short.
That’s where Power BI comes in — a modern business intelligence tool that transforms static data into dynamic dashboards and real-time insights. If you’re ready to evolve from spreadsheet-based reporting to smarter, data-powered decision-making, Power BI is the next step for you.
Why Spreadsheets Aren’t Enough
It goes without saying that after total domination of corporate spaces for the past few decades, Excel spreadsheets have become a universal mainstay across the board for professionals from all walks of life. However, as industries evolve and workspaces grow more digitalised, they can become a bottleneck for fast, accurate reporting when it comes to the overwhelming surplus of data. Many teams find the manual updates and formula errors compounded with poor data visualisation and layout limitations to be a significant drawback of established Excel sheets. Perhaps most problematic of all is the platform’s difficulty managing real-time data. In today’s data-rich environments, these limitations can hinder accurate reporting and delay decision-making. As the demand for advanced analytics grows, relying solely on spreadsheets is no longer sustainable.
What Is Power BI?
Microsoft’s answer to this upcoming demand for better layouts and streamlined reporting interfaces is Power BI — a next-generation data analytics and visualisation platform. It allows users to connect to multiple data sources, clean and transform data, and create interactive dashboards that update automatically. Unlike Excel, Power BI is built to handle large-scale data analytics with ease — empowering professionals to make faster, smarter business decisions.
Why Power BI Is Taking The World By Storm
1. Interactive Dashboards
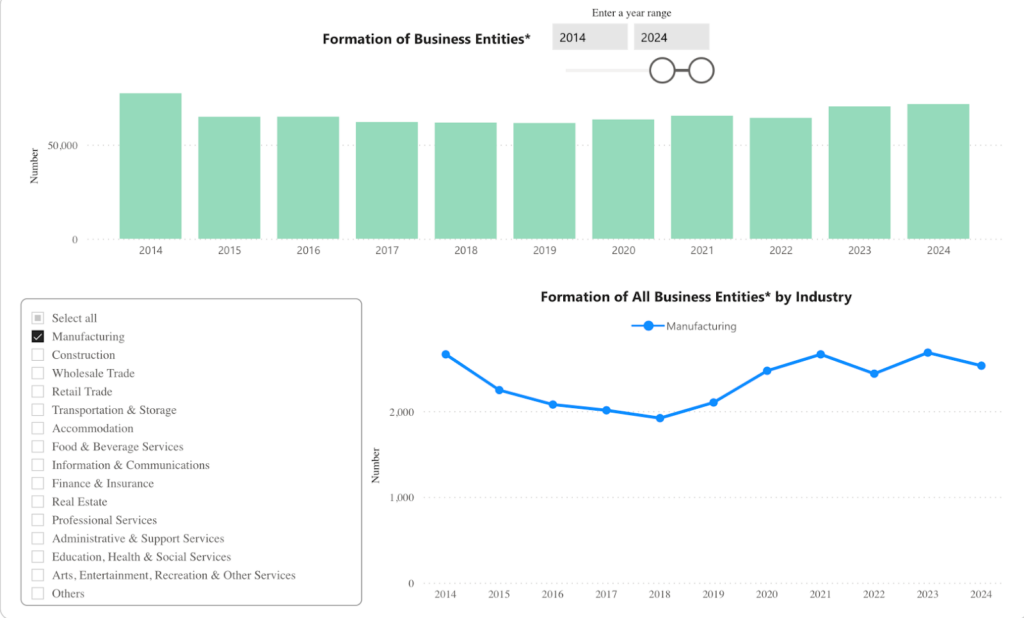
Source: Singstat
Say goodbye to static charts. Of the many reasons Power BI has taken the corporate world by enabling users to create live dashboards that respond to filters and drill-downs — helping you uncover trends at a glance.
2. Real-Time Data Connections
Power BI can be connected to data sources like Excel, SharePoint, SQL Server, and even cloud platforms like Google Analytics or Salesforce. Automated refreshes ensure you’re always looking at the latest numbers.
3. Powerful Data Visualisation
Whether you need bar charts, heatmaps, or complex KPI summaries, Power BI offers a rich visual toolkit for presenting data clearly and persuasively through custom visuals.
4. Team Collaboration
Integrated with Microsoft Teams, Power BI allows seamless sharing of dashboards and reports. No more emailing spreadsheets back and forth — everyone stays on the same page.
5. Scalable for Any Organisation
Whether you’re a startup or an enterprise, Power BI supports scalable data models, complex DAX formulas, and advanced analytics. It’s a long-term solution for businesses looking to embed analytics into their culture.
How We Can Help ?
At James Cook Institute, our Introduction To Data Analysis Using Excel And Power BI (beginner) and Data Visualisation Techniques Using Power BI (intermediate) courses are designed to help professionals apply data analytics confidently in their roles. Be it individuals moving into data-driven roles or managers looking to upskill their team, our tailored, WSQ-certifiable courses will ensure you leave with everything you need for real-world application of Power BI within just two days.
From Excel to Excellence
Spreadsheets will always have their place, but Power BI offers a more powerful, scalable, and collaborative way to analyse and present data. The learning curve can be steep, but if you’re looking to upskill your team for a more digital, data-driven workplace — James Cook Institute will be here for you every step of the way.