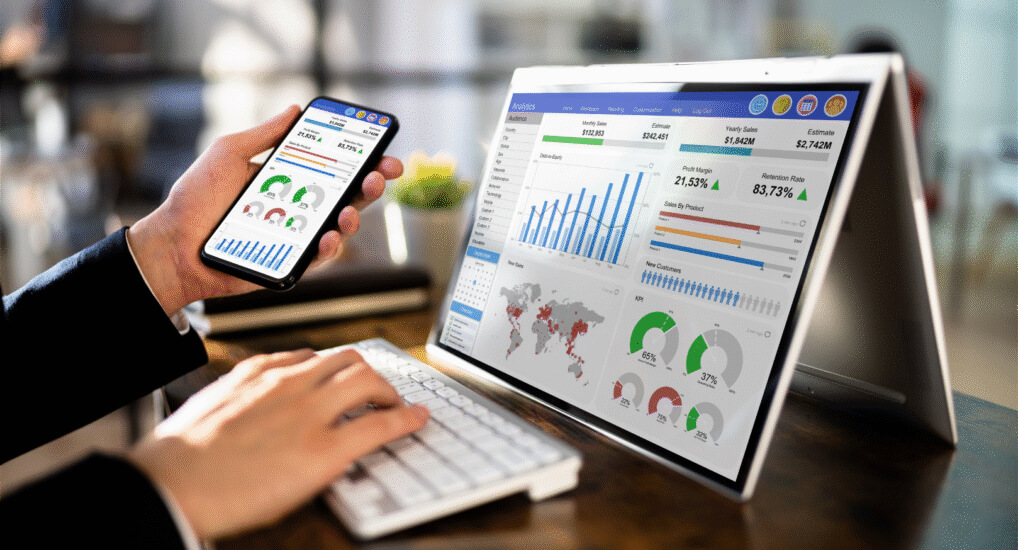
Reporting with Pivot Table and Pivot Chart

Course Overview

This course equips participants with the skills to use Excel tools effectively for creating spreadsheet solutions and performing statistical analysis. It is ideal for individuals who need to manage and analyse data using Microsoft Excel.

Skills Acquired

At the end of the course, participants will be able to use Excel to transform transactional data into summary reports.

Learning Modules

  • Managing the Underlying Data
  • Creating, modifying a Pivot Table
  • Summarizing data by using summary functions other than SUM, such as COUNT or MAX
  • Showing data as a percentage of the total by using a custom calculation
  • Creating your own formula inside a PivotTable report by using a calculated field
  • Modifying the data source and refresh the Pivot Table
  • Filtering, sorting data in a Pivot Table
  • Automatically group data to view a quarterly summary instead of a daily summary in a Pivot Table
  • Manually group data and rename groups
  • Comparing values inPivot Table to show Year-Over-Year Percentage Change
  • Creating Pivot Table using MS Query
  • Creating Pivot Chart
  • Improving the Pivot Chart presentation
  • Creating multiple Pivot Chart quickly
  • Printing Pivot Table and Pivot Chart

Who is this course for

This course is intended for participants who need to master the various commands available in Microsoft Excel’s PivotTable and PivotChart in order to summarise, analyse and create reports.

Academic prerequisites

  • Learners must be able to read, write, speak and listen to English at secondary school level
  • Learner should have working knowledge of Microsoft Excel

Course Fees

Fees Company / Self Sponsored
Full Fee $300
GST $27
Nett Fee Payable (incl. GST) $327
Reporting with Pivot Table and Pivot Chart

Have More Questions?

Lets start a conversation to upgrade your skillset